A table is a basic unit for data storage. Data in the table is stored in a cell that is an intersection of a vertical column and horizontal row. The table has a specified number of columns, but can have any number of rows. With DataGrip, you can perform data manipulation and data definition operations with tables.
Tables are more appropriate when:
-
The user needs to reference specific numerical values.
-
The user wants to compare numerical values and not vague similarities.
-
The values being displayed are unable to be compared using charts.
Here are two examples of tables:
| First Name |
Last Name |
Sex |
Spending |
Phone Number |
| John |
Smith |
Male |
$ 115.89 |
(401) 865-6141 |
| Jack |
Richardson |
Male |
$ 56.24 |
(401) 865-6142 |
| Mary |
Williams |
Female |
$ 84.33 |
(401) 865-6143 |
| Donald |
Tramp |
Male |
$ 321.58 |
(401) 865-6144 |
| Nancy |
Pelosi |
Female |
$ 212.37 |
(401) 865-6145 |
| Kevin |
McCarthy |
Male |
$ 247.96 |
(401) 865-6146 |
| Liz |
Cheney |
Female |
$ 89.51 |
(401) 865-6147 |
|
Unit sales of the Apple iPhone Worldwide from 2007 to 2018 (in millions)
| Year |
Sales |
Year |
Sales |
| 2007 |
1.39 |
2013 |
150.26 |
| 2008 |
11.63 |
2014 |
169.22 |
| 2009 |
20.73 |
2015 |
231.22 |
| 2010 |
39.99 |
2016 |
211.88 |
| 2011 |
72.29 |
2017 |
216.76 |
| 2012 |
125.05 |
2018 |
217.72 |
|
In designing an effective table, keep in mind the data-ink ratio and avoid the
use of unnecessary ink tables:
-
Avoid using vertical lines because they make tables look cluttered and therefore unreadable.
-
Horizontal lines are generally used to separate the titles of columns.
-
In large tables, vertical lines or light shading can be usedful to help the
reader distinguish the columns and rows.
-
Horizontal lines are used for separating column titles from data values or
when indicating that a calculation has taken place.
-
Columns of numerical values in a table should be right-aligned.
-
All values should include the same number of digits to the right of the d
ecimal.
-
Left-align text values within a column in a table.
-
Column headings should either match the alignment of data in teh columns or be centered over the values.
Crosstabulation
A useful type of table for describing data of two variables is a crosstabulation, which provides a tabular summary of data for two variables.
Consider the following example that
shows a survey of what electronic gadget a group of people were likely to buy in the next 6 months dependent on their age.
Crosstabulation of Age and Purchase of Electronic Gadget (2017)
| Age |
Laptop |
Phone |
Tablet |
Digital Camera |
| 20--24 |
38% |
29% |
31% |
12% |
| 25--29 |
19% |
15% |
24% |
17% |
| 30--34 |
23% |
19% |
11% |
27% |
| 35--39 |
19% |
12% |
9% |
30% |
| above 40 |
12% |
17% |
5% |
31% |
You can see the distinctive connection between the age and the purchase of the electronic gadget.
PivotTables in Excel
A crosstabulation in Microsoft Excel in known as PivotTable.
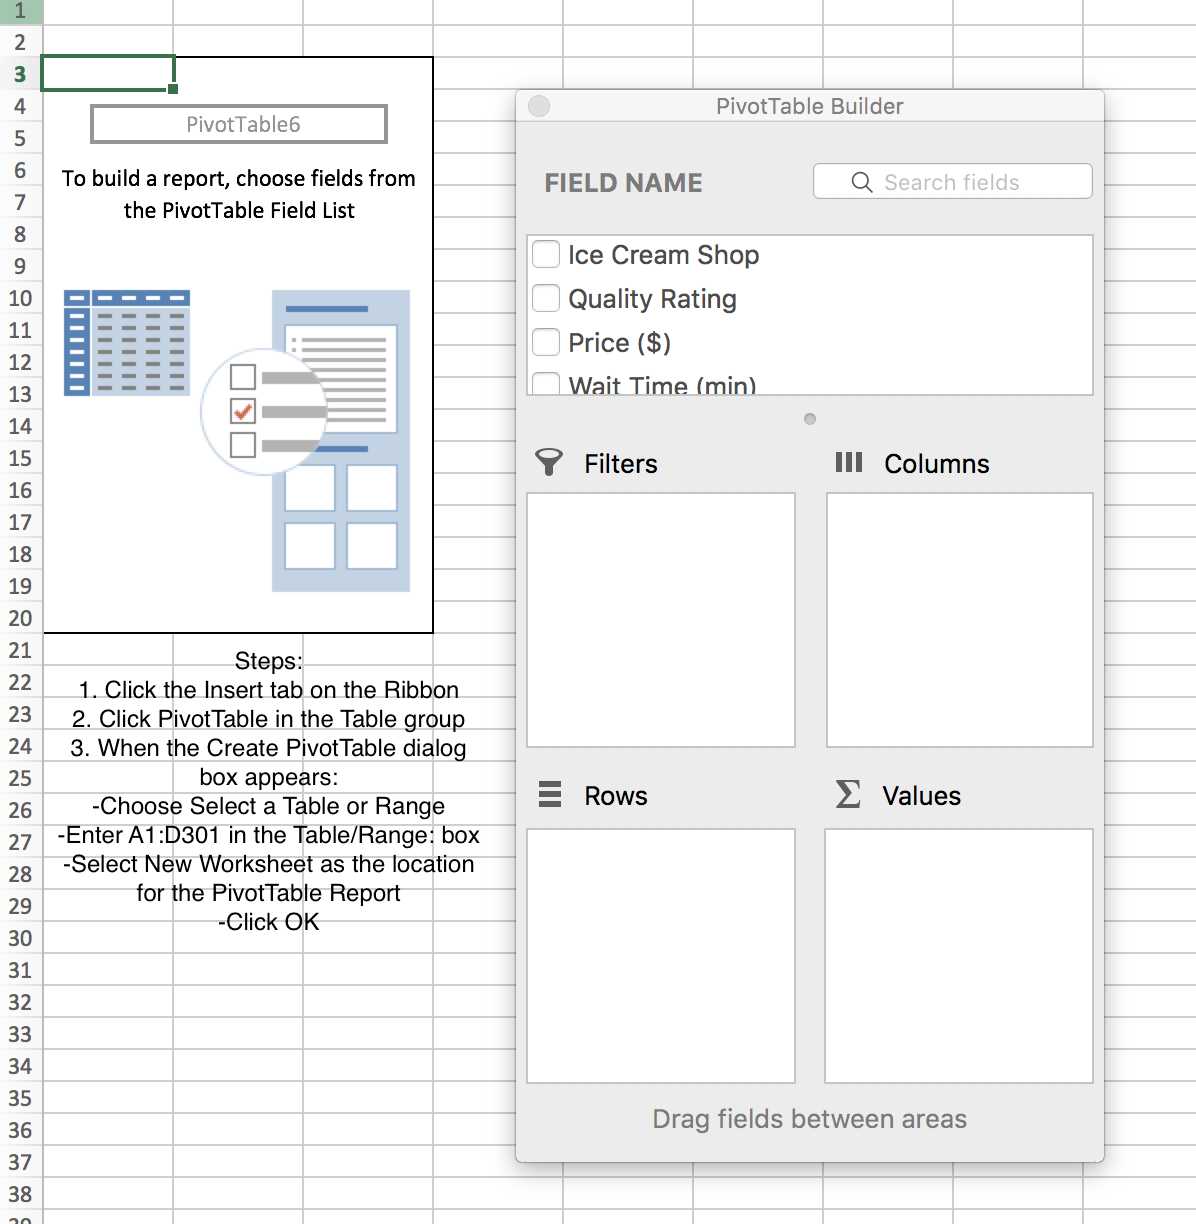
PivotTables in Excel are interactive and they may be used to display statistics or a simple count of numbers. So follow the following steps.
-
Click Insert, click PivotTable in the Tables group
-
When the Create PivotTable appears: choose Select a Table or Range, select New Worksheet, click OK
-
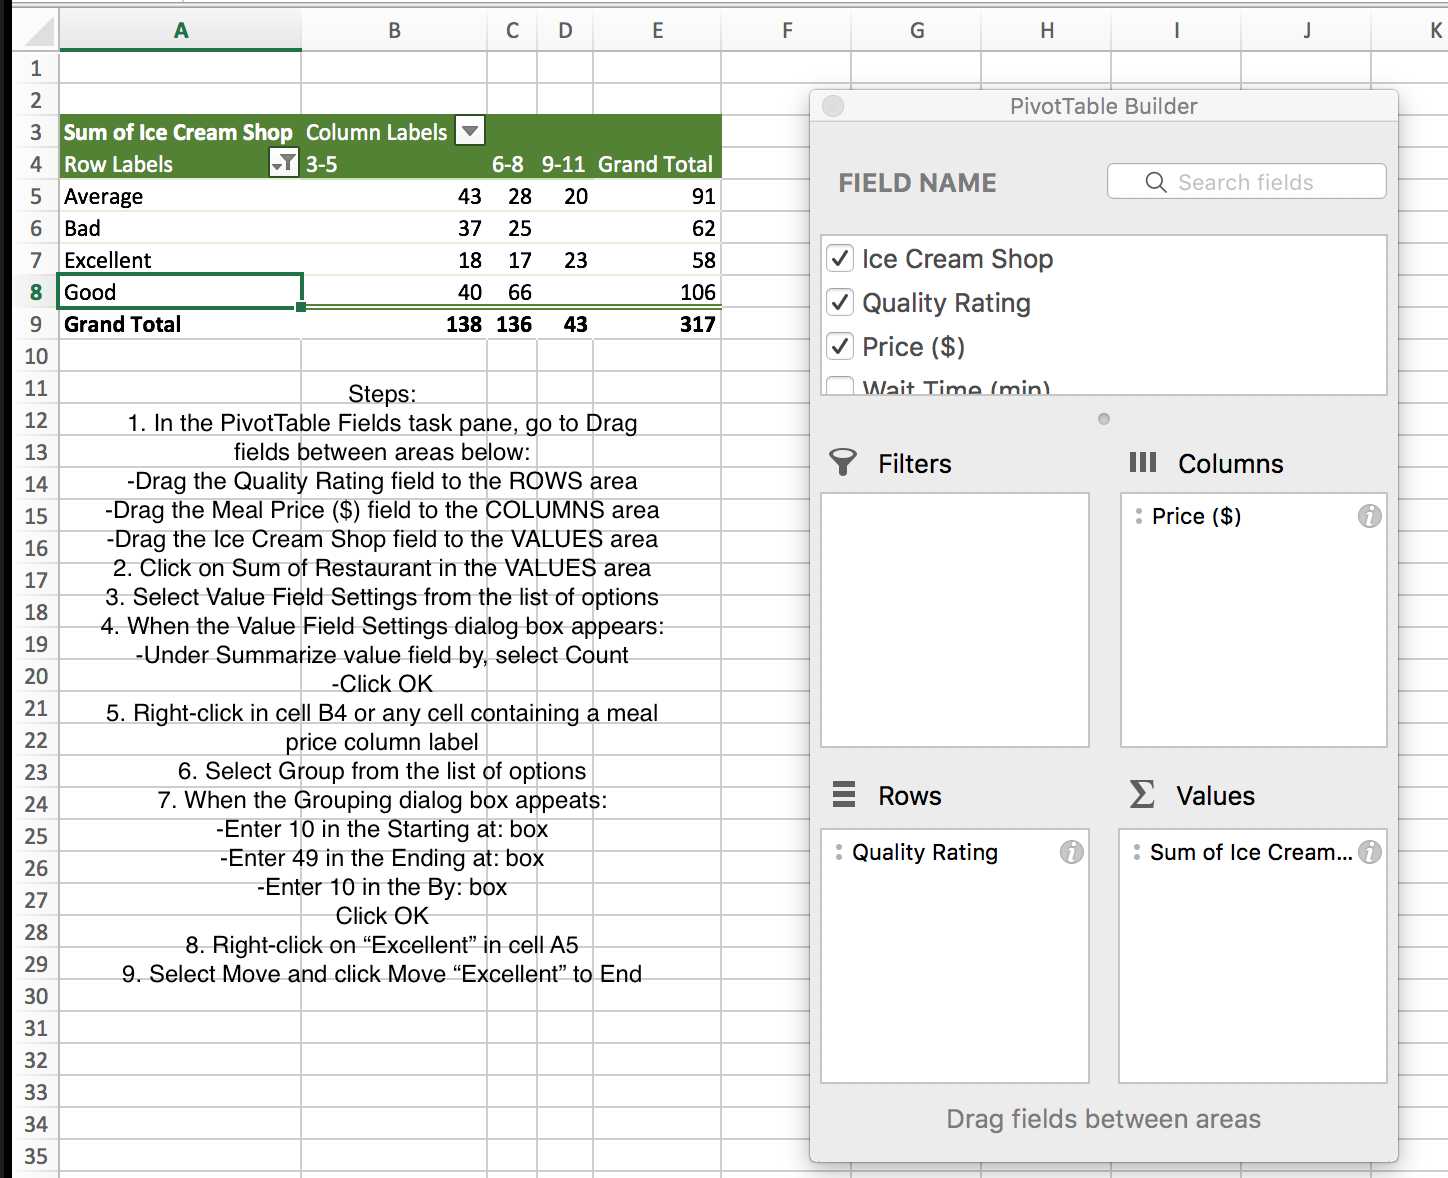
In the PivotTable Fields task pane, go to Drag fields between areas below
-
Select Value Field Settings from the list of options
-
When the Value Field Settings dialog box appears: Under Summarize value
field by, select Count, Click OK.
Example: Consider the data that comes from reviews of 25 Ice Cream
Shops in New York.
Quality Rating for Ice Cream
Shops in New York
| Ice Cream |
Quality Rating |
Price ($) |
Wait Time (min) |
| 1 |
Average |
5 |
10 |
| 2 |
Good |
7 |
6 |
| 3 |
Bad |
4 |
3 |
| 4 |
Average |
6 |
5 |
| 5 |
Average |
5 |
15 |
| 6 |
Excellent |
8 |
8 |
| 7 |
Good |
5 |
0 |
| 8 |
Excellent |
6 |
13 |
| 9 |
Good |
6 |
20 |
| 10 |
Average |
6 |
12 |
| 11 |
Excellent |
7 |
5 |
| 12 |
Good |
7 |
16 |
| 13 |
Bad |
5 |
21 |
| 14 |
Average |
6 |
5 |
| 15 |
Average |
5 |
2 |
| 16 |
Good |
3 |
10 |
| 17 |
Good |
5 |
11 |
| 18 |
Excellent |
3 |
3 |
| 19 |
Good |
7 |
0 |
| 20 |
Average |
9 |
13 |
| 21 |
Bad |
4 |
15 |
| 22 |
Average |
5 |
11 |
| 23 |
Excellent |
10 |
6 |
| 24 |
Good |
8 |
3 |
| 25 |
Bad |
6 |
2 |
|
|
|