Return to computing page for the second course APMA0340
Return to Mathematica tutorial for the first course APMA0330
Return to Mathematica tutorial for the second course APMA0340
Return to the main page for the first course APMA0330
Return to the main page for the second course APMA0340
Return to Part VI of the course APMA0340
Introduction to Linear Algebra
Glossary
van der Pol Equations
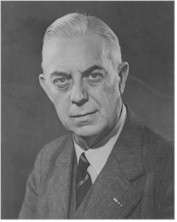
The van der Pol oscillator is a non-conservative oscillator that is modeled by the following differential equation
In the September 1927 issue of the British journal Nature, Van der Pol and his colleague J. van der Mark published an article entitled "Frequency Demultiplication" in which they reported an "irregular noise" before transition from one subharmonical regime to another one. By reconstructing his electronic tube circuit, we now know that they had discovered deterministic chaos. Their paper is probably one of the first experimental reports of chaos. In particular, they considered the forced oscillations of a triode, but in the field of relaxation oscillations:
During the 1930s, Russian mathematicians Nikolai M. Krylov (1879--1955) and Nikolai N. Bogolyubov (1909--1992), inscribed the slowly varying amplitudes method unveiled a few years earlier by van der Pol in the framework of a theory that now bares their names. The Krylov--Bogolyubov averaging method is based on the averaging principle when the exact differential equation of the motion is replaced by its averaged version. Their work attracted quite a bit of attention with full support of the famous French mathematician Jacques Hadamard (1865--1963). They put mathematical foundation into van der Pol experimental research.
Between 1931 and 1933. many articles were published in Russian on the study of resonance and frequency demultiplication phenomena by a group of scientists, including Leonid Mandelshtam, Nikolai Papalexi, Alexandr Andronov, Semen Khaikin, and Alexander Witt. They analyzed the stability of periodic solutions based on Poincaré--Lindstedt method.
In 1945, M.L. Cartwright and J.E. Litlewood published the article where they showed that the van der Pol equation admits singular solutions for large values of parameter μ. Later in 1949, N. Levinson analytically analyzing the van der Pol equation confirms that it has singular solutions. On the basis of numerical simulations, it was observed that the transition from periodic oscillations to chaotic ones is possible. Further history of analyzing van der Pol oscillator could be found in the article by Ginoux and Letellier.
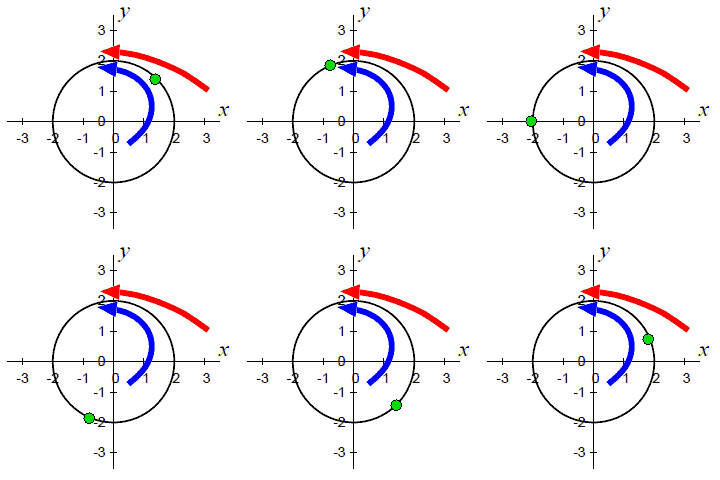
To analyze stability of solutions to van der Pol equation, we rewrite his second order differential equation
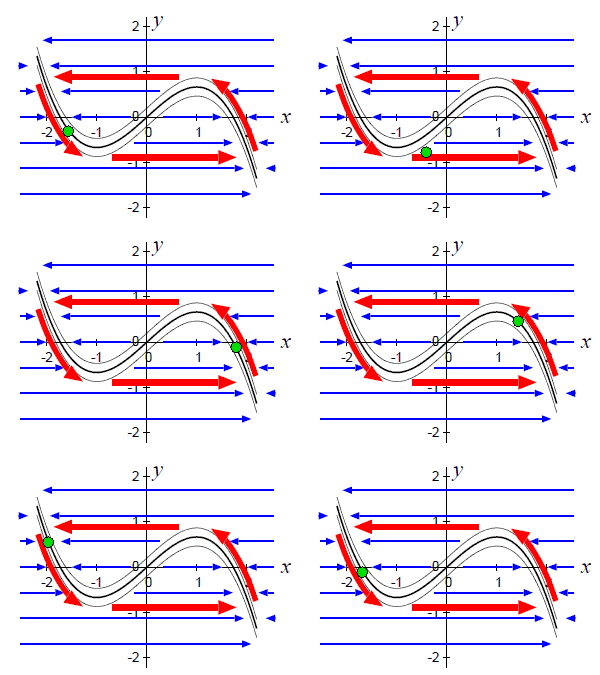
On the other hand, when x is large, the cubic term x3 becomes dominant and the damping becomes positive. In this case, \( \dot{V}(x,y) \le 0 . \) Energy is dissipated for large displacement corresponding to |x| > 1. Therefore, the system is expected to be restricted in some area around the fixed point and the system approaches a limit cycle. Using the Liénard's transformation \( y = x - x^3 / - \dot{x} /\epsilon , \) the van der Pol equation can be rewritten as
 |
 |
Actually, the van der Pol equation is a particular case of more general Liénard equation:
Our next step in analyzing the trajectories of the van der Pol equation is to linearize the corresponding system of first order equations. Although Mathematica has a dedicated command JacobianMatrix, we calculate it directly. First, we build a matrix of its slope functions.
|
vdot[t_] = mu (1 - x[t]^2)*x'[t] - x[t]
vdot05[t_] = vdot[t] /. mu -> 0.5
Out[6]= -x[t] + 0.5 (1 - x[t]^2) Derivative[1][x][t]
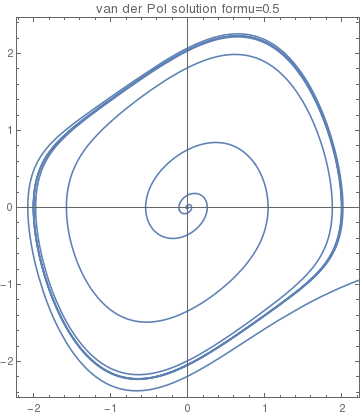
Orbit1 = NDSolve[{v'[t] == vdot05[t], x'[t] == v[t], x[0] == 0.01, v[0] == 0}, {x, v}, {t, 0, 40}]
Out[7]= {{x->InterpolatingFunction[{0.,40.}},<>],
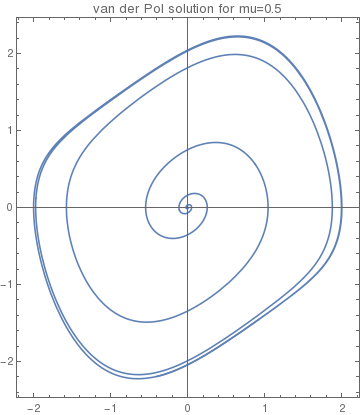
v->InterpolatingFunction[{0.,40.}},<>]}} plot05 = ParametricPlot[{x[t] /. Orbit1[[1]], |
|
| A solution of the van der Pol equation \eqref{EqPol.1}. | Mathematica code |
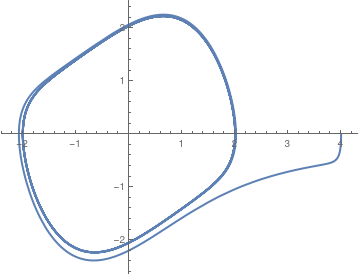
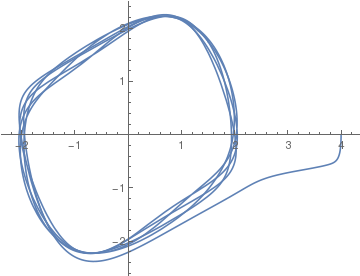
Then we take another initial condition far away from the origin.
|
vdot[t_] = 0.5 (1 - x[t]^2)*v[t] - x[t]
Orbit2 = NDSolve[{v'[t] == 0.5 (1 - x[t]^2)*v[t] - x[t], x'[t] == v[t], x[0] == 4.0, v[0] == 0}, {x, v}, {t, 0, 40}]; plot054 = ParametricPlot[{x[t] /. Orbit2[[1]], v[t] /. Orbit2[[1]]}, {t, 0, 40}, PlotStyle -> Thick] |
|
| Another solution to the van der Pol equation \eqref{EqPol.1}. | Mathematica code |
|
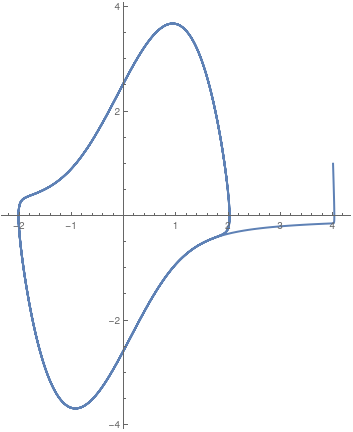
Now we plot a solution curve when parameter μ is larger than 1,
vdot[t_] = 1.89 (1 - x[t]^2)*v[t] - x[t]
Orbit2 = NDSolve[{v'[t] == 0.5 (1 - x[t]^2)*v[t] - x[t], x'[t] == v[t], x[0] == 4.0, v[0] == 1.0}, {x, v}, {t, 0, 40}]; plot054 = ParametricPlot[{x[t] /. Orbit2[[1]], v[t] /. Orbit2[[1]]}, {t, 0, 40}, PlotStyle -> Thick] |
|
| A solution curve to the van der Pol equation \eqref{EqPol.1} when μ = 1.89. | Mathematica code |
|
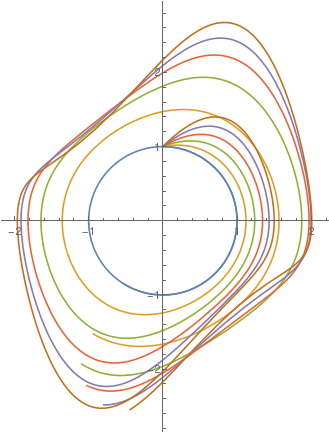
Upon changing the value of parameter μ, we plot solutions to the van der Pol equation \eqref{EqPol.1}, starting with μ = 0 (the limit cycle has the form of pure circle), with step size 0.2 untill μ = 1.
sol[mu_?NumericQ] := First@NDSolve[{y''[t] - mu*(1 - y[t]^2) y'[t] + y[t] == 0, y[0] == 0,
y'[0] == 1}, y, {t, 0, 10}]
ParametricPlot[Evaluate[{y[t], y'[t]} /. sol[#] & /@ Range[0, 1, 0.2]], {t, 0, 10}] |
|
| A family of solutions to the van der Pol equation for different values of parameter μ. | Mathematica code |
|
You can also use ParametricNDSolve:
sol = ParametricNDSolveValue[{y''[t] - mu*(1 - y[t]^2) y'[t] + y[t] == 0, y[0] == 0, y'[0] == 1}, y, {t, 0, 10}, {mu}];
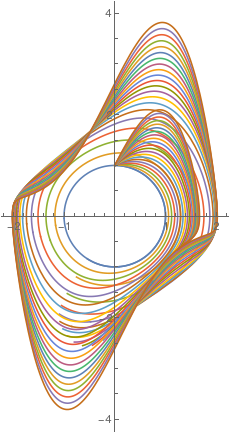
The figure shows the change in graphs when parameter μ changes within the range [0, 2].
ParametricPlot[Evaluate[{sol[#][t], D[sol[#][t], t]} & /@ Range[0, 2, 0.1]], {t, 0, 10}] |
|
| A family of solutions to the van der Pol equation for different values of parameter μ. | Mathematica code |
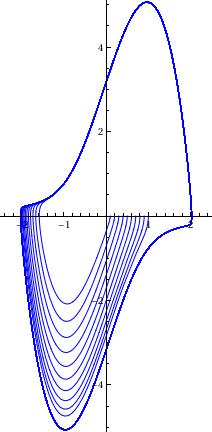
Now we pick up a large value for parameter μ:
Orbit3 = NDSolve[{v'[t] == vdot3[t], x'[t] == v[t], x[0] == 0.01, v[0] == 0}, {x, v}, {t, 0, 40}]
40}, Frame -> True, AspectRatio -> 1.0, PlotRange -> 5.1, PlotLabel -> "van der Pol solution for mu =3"]
NDSolve[{v'[t] == vdot3[t], x'[t] == v[t], x[0] == 3.0,
v[0] == 0}, {x, v}, {t, 0, 40}]
plot33 = ParametricPlot[{x[t] /. Orbit33[[1]],
v[t] /. Orbit33[[1]]}, {t, 0, 40}, Frame -> True,
AspectRatio -> 1.0, PlotRange -> 5.1,
PlotLabel -> "van der Pol solution for mu =3"]
Evaluate[Table[{x[t], x'[t]} /.
NDSolve[{x''[t] - 3 (1 - (x[t])^2) x'[t] + x[t] == 0, x[0] == c,
x'[0] == 0}, {x[t], x'[t]}, {t, 0, 50}], {c, -1, 1, 0.1}]], {t,
0, 50}, PlotRange -> {{-3, 3}, {-5.1, 5.1}}, PlotStyle -> Purple]
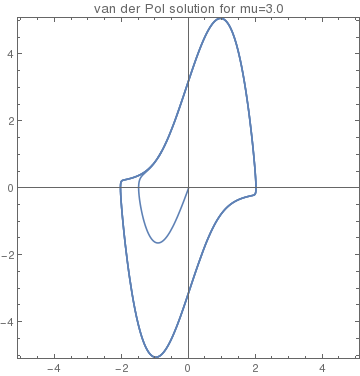
initial conditions inside the unit circle |
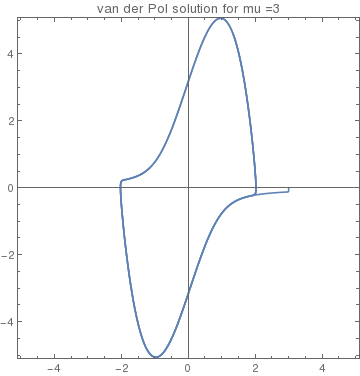
initial conditions outside the unit circle |
Plot with colors (Orlando):
ParametricPlot[
Evaluate[{x[t], x'[t]} /.
NDSolve[{x''[t] - 3 (1 - (x[t])^2) x'[t] + x[t] == 0, x[0] == c,
x'[0] == 0}, {x[t], x'[t]}, {t, 0, 50}]], {t, 0, 50},
PlotRange -> {{-3, 3}, {-5.1, 5.1}},
PlotStyle -> Hue[(c + 1)/2]], {c, -1, 1, 0.1}]]
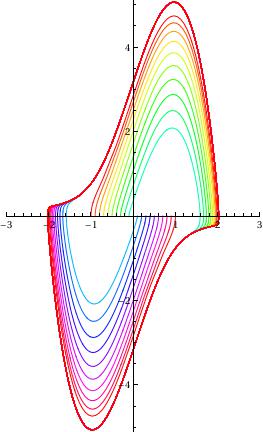
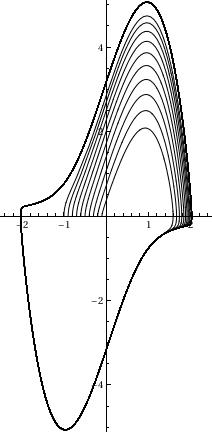
with two colors:
Evaluate[Table[{x[t], x'[t]} /.
NDSolve[{x''[t] - 3 (1 - (x[t])^2) x'[t] + x[t] == 0, x[0] == c,
x'[0] == 0}, {x[t], x'[t]}, {t, 0, 50}], {c, -1, 0, 0.1}]], {t,
0, 50}, PlotRange -> {{-2.5, 2.5}, {-5.1, 5.1}},
PlotStyle -> Black]
blue = ParametricPlot[
Evaluate[Table[{x[t], x'[t]} /.
NDSolve[{x''[t] - 3 (1 - (x[t])^2) x'[t] + x[t] == 0, x[0] == c,
x'[0] == 0}, {x[t], x'[t]}, {t, 0, 50}], {c, 0, 1, 0.1}]], {t,
0, 50}, PlotRange -> {{-2.5, 2.5}, {-5.1, 5.1}}, PlotStyle -> Blue]
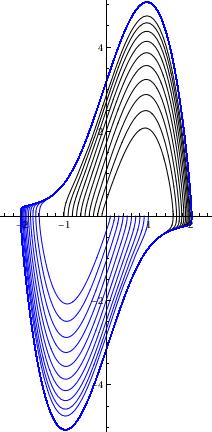
With direction field:
field = VectorPlot[{y, 1*(1 - x^2)*y - x}, {x, -4.2, 4.2}, {y, -6.5, 6.5}, VectorScale -> {Small, 1}]

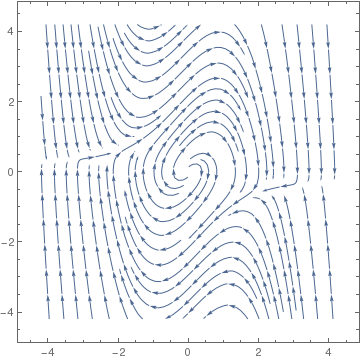
Instead of Vectorplot, sometimes StreamPlot presents the phase portrait better:
StreamPlot[{y, 1*(1 - x^2)*y - x}, {x, -4.2, 4.2}, {y, -4.2, 4.2},
VectorScale -> {Small, 1}]
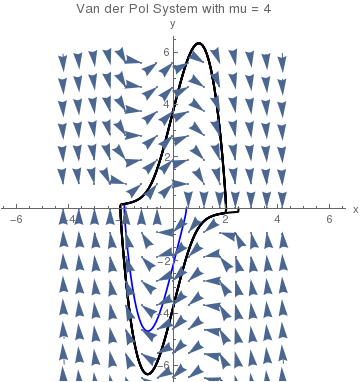
de2 = y'[t] == 4*(1 - (x[t])^2)*y[t] - x[t];
soln1 = NDSolve[{de1, de2, x[0] == 0.5, y[0] == 0}, {x, y}, {t, 0, 40}]
soln2 = NDSolve[{de1, de2, x[0] == 2.5, y[0] == 0}, {x, y}, {t, 0, 40}]
plot1 = ParametricPlot[Evaluate[{x[t], y[t]} /. soln1], {t, 0, 40},
PlotStyle -> {RGBColor[0, 0, 1], Thickness[0.005]}, DisplayFunction -> Identity, PlotRange -> 6.6]
plot2 = ParametricPlot[Evaluate[{x[t], y[t]} /. soln2], {t, 0, 40},
PlotStyle -> {Black, Thickness[0.006]}, DisplayFunction -> Identity]
AxesLabel -> {"x", "y"}, DisplayFunction -> $DisplayFunction]
Kplot = Plot[Evaluate[x[t] /. soln2[[1]][[1]]], {t, 0, 40},
PlotStyle -> RGBColor[0, 0, 1], DisplayFunction -> Identity]
Vplot = Plot[Evaluate[y[t] /. soln2[[1]][[2]]], {t, 0, 40},
PlotStyle -> Black, DisplayFunction -> Identity]
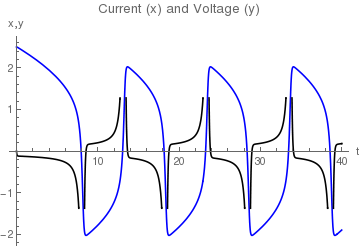
Show[Kplot, Vplot, PlotLabel -> "Current (x) and Voltage (y)",
AxesLabel -> {"t", "x,y"}, DisplayFunction -> $DisplayFunction]
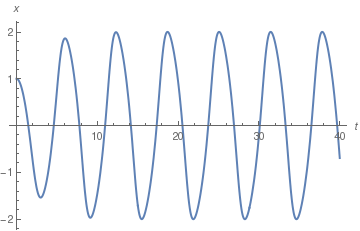
If you want to determine just one variable x, you don't need to transfer van der Pol equation to the system; Mathematica allows you to find it.
Plot[x[t]/.numsol05, {t,0,40}, PlotStyle->Thick, AxesLabel->{t,x}]
Now we define a subroutine solgraph that depends on two parameters: μ and opts (which is shortcut for option in Plot command).
{sol,p1,p2,p3,data,system,z,x1, x2,t,ode1,ode2,timeScale},
ode1 =x1'[t]==x2[t];
ode2 =x2'[t]==z(1-x1[t]^2)x2[t]-x1[t];
timeScale ={t,0,80};
sol=First@NDSolve[ {ode1,ode2/.z->mu,x1[0]==0.01,x2[0]==0},
{x1[t],x2[t]},
timeScale,Method->{"Extrapolation", Method->"LinearlyImplicitEuler"}];
sol = {x1[t],x2[t]}/.sol;
p1 = Plot[Evaluate[sol[[1]]],
Evaluate[timeScale], Frame->True, FrameLabel->{"time","y(t)"}, PlotLabel->"\[Mu]="<>ToString[mu]];
p2 = Plot[Evaluate[sol[[2]]], Evaluate[timeScale],
Frame->True, FrameLabel->{"time","y'(t)"}, PlotLabel->"\[Mu]="<>ToString[mu], PlotStyle->RGBColor[1,0,0]];
data = Table[{Evaluate[sol[[1]]], Evaluate[sol[[2]]]}, Evaluate[timeScale]];
p3=ListPlot[data,Joined->True,Frame->True,
PlotLabel->"\[Mu]="<>ToString[mu], FrameLabel->{"y(t)","y'(t)"}, PlotRange->All];
{p1,p2,p3}
];
mu={0.1,.2,1,3,5,10};
r = process/@mu; Grid[r]
It is right time to mention some generalizations of the van der Pol equation. For instance, the following one:
One particular characteristic in the van der Pol model is that its phase depends on initial conditions. Therefore, if two van der Pol oscillators run with different initial conditions, their trajectory will finally circulate on the same limit cycle with different phases φ1 and φ2. The chaos synchronization problem can be formulated as follows: Given a chaotic system, which is considered as the master (or driving) system, and another identical system, which is considered as the slave (or response) system, the aim is to force the response of the slave system to synchronize the master system in such a way that the dynamical behaviors of these two systems be identical after a transient time.
■Liénard's theorem can be used to prove that the system has a limit cycle. Applying the Liénard transformation \( y = x - x^3 / 3 - \dot{x}/\mu , \) where the dot indicates the time derivative, the Van der Pol oscillator can be written in its two-dimensional form:
Driven van der Pol Equations
plot22 = ParametricPlot[{x[t] /. Orbit22[[1]], v[t] /. Orbit2[[1]]}, {t, 0, 40}]
|
|
Upon introducing new parameter ε = 1/μ², we convert the forced van der Pol equation to autonoumous system of equations:
Chaos
During their experiments with frequency demultiplication in electrical circuits, van der Pol and van der Mark were the first to observe the onset of chaos in a simple nonlinear system. At the time, however, they did not fully appreciate the significance of this phenomenon. Inspired by van der Pol’s work, Mary Cartwright and J. E. Littlewood proceeded to investigate the problem mathematically. For a modern review of this subject, see J. M. T. Thompson and H. B. Stewart.
Hamiltonian for van der Pol Equations
- Adelakun, A.O., Njah, A.N., Olusola, O.I. and Wars, S.T., Computer and Hardware Modeling of Periodically Forced -Van der Pol Oscillator, Active and Passive Electronic Components Volume 2016, Article ID 3426713, 7 pages http://dx.doi.org/10.1155/2016/3426713.
- Albarakati, W.A., Lloyd, N.G. & Pearson, J.M., Transformation to Liénard form, Electronic Journal of Differential Equations, Vol. 2000 (2000), No. 76, pp. 1--11.
- Cartwright, M.L. and Litlewood, J.E., "On Non‐Linear Differential Equations of the Second Order: I. the Equation \( y'' - k (1 - y^2) y' +y = b\lambda k\,\cos (\lambda t + \alpha ), \) k large", Journal of the London Mathematical Society, 20, Issue 3, pp. 180--189, 1945; https://doi.org/10.1112/jlms/s1-20.3.180
- G. Chen and X. Dong, From Chaos to Order: Methodologies, Perspectives and Applications, World Scientific, Singapore, 1998.
- Cooper, M, Heidlauf, P. and Sands, T., Controlling Chaos—Forced van der Pol Equation.
- D’Acunto, M., Determination of limit cycles for a modified van der Pol oscillator, Mechanics Research Communications, 2006, Vol. 33, No. 1, pp. 93--98; doi: 10.1016/j.mechrescom.2005.06.012
- Dadfar, M.B. and Geer, J..F., Resonances and Power Series Solutions of the Forced Van Der Pol Oscillator, SIAM Journal of Applied Mathematics, Vol. 50, No. 5, pp. 1496--1506, 1990.
- Gh. Asadi Cordshooli and Vahidi, A.R., Phase synchronization of van der Pol--Duffing oscillators using decomposition method, Advanced Studies in Theoretical Physics, Vol. 3, No. 11, pp. 429--437.
- Ginoux, J.-M., and Letellier, C., Van der Pol and the history of relaxation oscillations: toward the emergence of a concept, 2012.
- Gleick, James, Chaos: Making a New Science 1987.
- Guckenheimer, J., Hoffman, K. and Weckesser, W., The Forced van der Pol Equation I: The Slow Flow and Its Bifurcations, SIAM Journal of Applied Dynamic Systems, 2003 Society for Industrial and Applied Mathematics Vol. 2, No. 1, pp. 1–35.
- Guckenheimer, J., Hoffman, K. and Weckesser, W., The Forced van der Pol Equation II: anards in the Reduced System , SIAM Journal of Applied Dynamic Systems, 2003 Society for Industrial and Applied Mathematics Vol. 2, No. 4, pp. 570--608.
- Holmes, P.J. and Rand, D.A., Bifurcation of the forced van der Pol oscillator, Quarterly of Applied Mathematics, 1978, No. 1, pp. 495--509.
- Janson, N.B., Balanov, A.G., Anishchenko, V.S., and McClintock, P.V.E., Phase relationships between two or more interacting processes from one-dimensional time series. I. Basic theory, Physical Review, E, Vol. 65, 036211 2002, doi: https://doi.org/10.1103/PhysRevE.65.036211
- Janson, N.B., Balanov, A.G., Anishchenko, V.S., and McClintock, P.V.E., Phase relationships between two or more interacting processes from one-dimensional time series. II. Application to heart-rate-variability data, Physical Review, E, Vol. 65, 036212 (2002)
- Levinson, N., A Second Order Differential Equation with Singular Solutions Norman Levinson, Annals of Mathematics, Second Series, Vol. 50, No. 1 (Jan., 1949), pp. 127-153 (27 pages).
- Kovacic, I. and Mickens, R.E., A generalized van der Pol type oscillator: Investigation of the properties of its limit cycle, Mathematical and Computer Modelling Volume 55, Issues 3–4, February 2012, Pages 645--653, https://doi.org/10.1016/j.mcm.2011.08.038
- Pinto, Carla and Machado, T., Complex-order forced van der Pol oscillator, Journal of Vibration and Control, 18(14) 2201–2209, 2011. doi: 0.1177/1077546311429150
- Semenova, N.I. and Anishchenko V.S., Fibonacci stairs and the Afraimovich-Pesin dimension for a stroboscopic section of a nonautonomous van der Pol oscillator, Chaos, Vol. 25, Issue 7, 073111 (2015); https://doi.org/10.1063/1.4926453
- Soomro, A.S., Tularam, G.A., Shaikh, M.M., A Comparison of Numerical Methods for Solving the Unforced Van Der Pol’s Equation, Mathematical Theory and Modeling, 2013, Vol. 3, No. 2.
- J. M. T. Thompson and H. B. Stewart, Nonlinear Dynamics and Chaos, 2nd ed., (Chichester: John Wiley & Sons, 2002).
- Tsatsos, Marios, Theoretical and Numerical Study of the van der Pol equation. 2006.
- Van der Pol, B. and Van der Mark, J., Frequency demultiplication, Nature, 120, Number 3019, 1927, pp. 363--364.
- Van der Pol oscillator
- van der Pol oscillator Scholarpedia.
- Xu, J.-X. and Jiang, J., The Global Bifurcation Characteristics of the Forced van der Pol oscillator, Chaos, Solitons, and Fracrals, Vol. 7. No. 1. pp 3--19. 1996.
Return to Mathematica page
Return to the main page (APMA0340)
Return to the Part 1 Matrix Algebra
Return to the Part 2 Linear Systems of Ordinary Differential Equations
Return to the Part 3 Non-linear Systems of Ordinary Differential Equations
Return to the Part 4 Numerical Methods
Return to the Part 5 Fourier Series
Return to the Part 6 Partial Differential Equations
Return to the Part 7 Special Functions